Bitcoin Rainbow Chart predicts BTC price for March 31, 2026
Understanding the Bitcoin Rainbow Chart
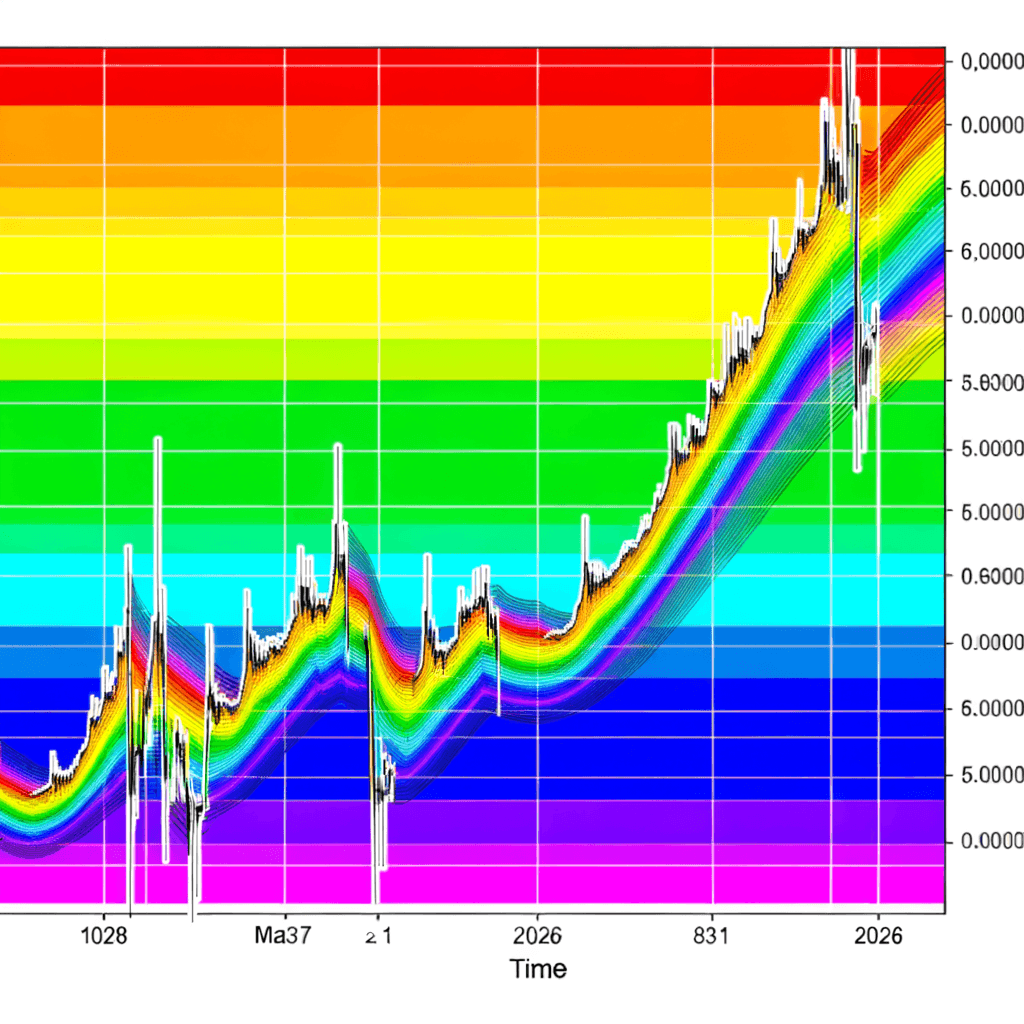
The Bitcoin Rainbow Chart is a fascinating tool within the cryptocurrency market, particularly for Bitcoin (BTC), that offers a unique insight into understanding Bitcoin's market valuation against its historical cycles. This chart employs logarithmic regression bands to delineate varying phases of the market, ranging from significant undervaluation to potential speculative bubble territories.
Current Market Situation
As Bitcoin continues to navigate below the key psychological level of $70,000, many investors are turning to the Rainbow Chart for guidance. Recently, Bitcoin was trading at $67,535, experiencing a slight dip of 0.3% over the last 24 hours but showing resilience with a 1.5% uptick on a weekly scale.
The Rainbow Bands Explained
At the core of this analysis lies the Rainbow Chart bands that plot historical price behaviors. These bands offer a spectrum, beginning with the "Basically a Fire Sale" zone that signals extreme undervaluation, all the way to "Maximum Bubble Territory," suggesting overvaluation due to market exuberance.
Price Band Analysis for March 31
Examining the bands as projected for March 31, the "Basically a Fire Sale" zone—positioned between $42,995.69 and $56,134.77—suggests historical contexts where Bitcoin is perceived as deeply undervalued. This offers potential opportunities for discerning investors who believe in a long-term growth trajectory.
Next is the "BUY!" zone, from $56,134.77 to $75,631.88, where Bitcoin stands at present with its $67,500 valuation. This range is typically seen as an attractive buying point for investors seeking to capitalize on the likely future appreciation.
Climbing up the spectrum, investors encounter the "Accumulate" band, spanning $75,631.88 to $97,594.05. This transition zone signals the market regaining strength, aligning closer to the historical trend line.
Visualizing Market Recovery and Overvaluation
The subsequent bands encapsulate various stages of market sentiment. The "Still Cheap" zone from $97,594.05 to $125,972.37 denotes continued room for growth, while the "HODL!" band from $125,972.37 to $164,842.17 suggests Bitcoin approaches a more balanced market valuation.
In contrast, higher bands such as "Is this a bubble?" ($164,842.17 to $209,828.69) and "FOMO intensifies" ($209,828.69 to $268,676.59) potentially warn of speculative excess. They capture the psychology of markets where investors, driven by fear of missing out, may push valuations beyond sustainable levels.
The apex of speculative pricing is found in the "Sell. Seriously, SELL!" zone ($268,676.50 to $349,493.74) and "Maximum Bubble Territory" ($349,493.74 to $469,687.80), where historical parallels indicate extreme overvaluation and profit-taking strategies often emerge.
Conclusion: A Roadmap for Bitcoin Valuation
While the Rainbow Chart is not designed for precise short-term predictions, it serves as an innovative framework to assess Bitcoin's current standing and potential trajectory within the market cycle. As Bitcoin holds within the "BUY!" zone, it suggests room for growth toward the middle bands, representing a fair value that aligns more closely with its long-term trend.
Ultimately, it provides investors with a color-coded roadmap that resonates with both historical price action and investor sentiment—guiding those who choose to engage in strategic, long-term investments in the ever-evolving cryptocurrency landscape.
09.03.2026